Exhibit 10.6
Next Graphite
Aukam Deposit
Dr. Ian M Flint
Element 12
February 18, 2014
Contents
| Contents | 2 |
| List of Figures | 3 |
| List of Tables | 4 |
| Summary | 5 |
| Aukam Summary | 6 |
| Introduction | 7 |
| Background | 7 |
| Assumptions | 7 |
| NI 43-101 non-compliant | 7 |
| Location and Ownership | 7 |
| Accessibility | 7 |
| Climate | 8 |
| Infrastructure | 8 |
| History | 9 |
| Geological Setting | 10 |
| Mineralization | 13 |
| Introduction | 13 |
| Trenching, sampling and measuring of tailings heaps | 13 |
| Sampling and measuring of veins in the pit | 14 |
| Introduction | 14 |
| Incline at base of eastern wall of the open pit | 14 |
| Upper Adit | 15 |
| Lower adit, shear zone and surface vein | 15 |
| Weathered vein, lower access adit | 16 |
| Abandoned workings and vein structure | 17 |
| Grades | 18 |
| Processing – Test Work | 19 |
| Conclusions | 19 |
| Purpose | 20 |
| Scope | 20 |
| Methodology | 20 |
| Size Reduction | 21 |
| Flotation | 25 |
| Processing Circuit | 29 |
| Summary | 29 |
| Introduction | 29 |
| Test Work Implications | 30 |
| Overall Circuit | 31 |
| Size Reduction Circuit | 32 |
| Flotation and dewatering | 34 |
| Acid Leach Circuit | 35 |
| Operating Costs | 36 |
| Working Capital | 36 |
| Marketing | 37 |
| Processed Product | 37 |
| Risks | 39 |
| Technical | 39 |
| Personnel | 40 |
| Timelines | 40 |
| Marketing | 40 |
| 2 | Page |
List of Figures
| Figure 1: Open pit at the top of the mountain. | 9 |
| Figure 2: Stratigraphic section of the greater Aukam area(Germs [1995]). | 10 |
| Figure 3: Stratigraphic section of the Dabis formation | 11 |
| Figure 4: Stratigraphic section: Zaris basin | 11 |
| Figure 5: Unconformity, overlying Nama Group | 12 |
| Figure 6: Trenching of lower stockpile heap. | 13 |
| Figure 7: The three major stockpiles after trenching | 13 |
| Figure 8: Incline in the eastern wall of the main pit. | 14 |
| Figure 9: Close up view of Incline overlain by debris from pit. | 14 |
| Figure 10: Open pit Aukam Graphite mine | 15 |
| Figure 11: Upper adit and shear zone | 15 |
| Figure 12: Shear zone lower access adit | 16 |
| Figure 13: Exposed vein entrance lower access adit | 16 |
| Figure 14: Vein load 1 work face, lower access adit | 16 |
| Figure 15: 3D model of lower access adit and drift.. | 17 |
| Figure 16: Three step test work for the creation of graphene pre-cursor graphite | 20 |
| Figure 17: RM1 test for graphite particle size distribution. | 21 |
| Figure 18: RM2 test for graphite particle size distribution. | 21 |
| Figure 19: Test work grind particle size distribution.. | 22 |
| Figure 20: +50 Mesh (all particles larger than 297 µm) graphite | 23 |
| Figure 21: +80 Mesh graphite, post cone crushing. | 23 |
| Figure 22: +150 Mesh graphite, post cone crushing. | 24 |
| Figure 23: -150 Mesh graphite, post cone crushing. | 24 |
| Figure 24: Recovery of graphite as a function of time for four particle size classes. | 27 |
| Figure 25: Overall process circuit blocks | 31 |
| Figure 26: Initial crushing circuit | 32 |
| Figure 27: flotation, dewatering and water systems | 34 |
| 3 | Page |
List of Tables
| Table 1: Aukam cost summary | 5 |
| Table 2: Low, probable and high mine profit projections.. | 5 |
| Table 3: Estimated site auxiliary costs | 8 |
| Table 4: Production at the Aukam Graphite mine | 9 |
| Table 5: Summary of graphite waste heaps | 13 |
| Table 6: Phase one exploration program: analysis results.. | 18 |
| Table 7: Initial sample particle size distribution after cone crushing | 22 |
| Table 8: Condition, -#18 Aukam rougher flotation. | 26 |
| Table 9: Mass Balance, -#18 Aukam rougher flotation. | 26 |
| Table 10: Mass Balance, -#18 Aukam rougher flotation. | 26 |
| Table 11: Conditions of < 0.5 mm grind release flotation test | 27 |
| Table 12: Graphite recovery with time and particle size | 27 |
| Table 13: Primary time – release test grade response.. | 28 |
| Table 14: HCl (100% equivalent) consumption approximations | 30 |
| Table 15: Crushing circuit equipment and approximate costs | 33 |
| Table 16: Approximate pricing of the Next processing flotation plant | 35 |
| Table 17: Approximate costs of major equipment of the acid wash circuit | 35 |
| Table 18: Total estimated process plant costs | 36 |
| Table 19: Current particle size distribution with assumed recoveries. | 37 |
| Table 20: Case I: 94-97% product grade. | 38 |
| Table 21: Case II: 97-99% Product grades | 38 |
| Table 22: Case III: 99-99.9% Production grades | 38 |
| Table 23: Case IV: +99.9% Product grades | 39 |
| 4 | Page |
Summary
The cost summary of the Aukam project is summarized in Table 1. Working capital includes equipment costs, installation costs, and operations costs for a period of six months.
Table 1: Aukam cost summary
| Area | Capital costs | Working Capital | Per Tonne | Employees | ||||||||||||
| Processing | $ | 600,000 | $ | 1,160,000 | $ | 237 | 35 | |||||||||
| Site | $ | 390,000 | $ | 450,000 | $ | 48 | 3 | |||||||||
| Mining | $ | 40,000 | $ | 80,000 | $ | 32 | 5 | |||||||||
| Transport | $ | 170 | ||||||||||||||
| Total | $ | 1,030,000 | $ | 1,690,000 | $ | 487 | ||||||||||
This report only considers the surface waste dumps from prior mining. At a rate of 2,500 to 5,000 tonnes per year mining could be done by a small dozer/backhoe and truck for a cost of about $30,000 plus an additional $5,000 per month using two employees. Transportation of product has been assumed to be $170 per tonne delivered to the closest port.
The revenue projections for Aukam are shown in Table 2 for three scenarios: low, probable and high revenues. These are meant to cover the possible average value generated per tonne of graphite including products that may not have a market.
Table 2: Low, probable and high mine profit projections. These figures do not include corporate, any expatriate, travel, or royalty costs.
| Item | Low | Probable | High | |||||||||
| Revenue | 650 | 850 | 1080 | |||||||||
| Operation costs | 487 | 487 | 487 | |||||||||
| Marketing | 130 | 170 | 216 | |||||||||
| Total costs | 617 | 657 | 703 | |||||||||
| Difference | 33 | 193 | 377 | |||||||||
| 2500 tpy | $ | 82,500 | $ | 482,500 | $ | 942,500 | ||||||
| 5 | Page |
Aukam Summary
Aukam is a deposit first identified by Element 12 in 2011 as a past producer with a very good potential of re-starting within a short time frame. The deposit is located in the far south of Namibia just north of South Africa as shown by the Next Graphite (NG) symbol.
This mine has produced 25,000 tonnes during 30+ years of operation before the mine was abandoned during the Namibian conflicts of 1974. There are an estimated 180,000 tonnes of graphite bearing rocks in three surface stockpile grading approximately 40%. There is, also, an estimated 4 million tonnes of reserve of high-grade graphite from hydrothermal source.
Namibia is a country of ~2.5 million people with one of the highest per capita GDPs in Sub-Saharan Africa. Although an independent nation since 1990, it has close ties to South Africa and Europe. Mining’s contribution to Namibia’s gross domestic product - 10.4% in 2009, 8.5% in 2010, 9.5% in 2011 and 11.5% in 2012 - makes it one of the largest economic sectors of the country. Namibian government and ministries encourage private sector mining development and cooperation with international partners and foreign direct investment.
| ● | Aukam is the only historical graphite producer in Namibia |
| ● | Located on Aukam Farm 104, Bethanien Distric, 55 kilometers SW of Goageb near the South African border. |
| ● | Located within 200 km of the active port in Luderitz |
| ● | Connected by raid and road to both Angola and South Africa |
| ● | Situated on an eastern slope of a range of hills rising 150 meters above the surrounding valleys. |
| ● | Visible graphite production zone strikes east-west, and measures approximately 1000 ft L x 500 ft W x 300 ft D |
| ● | Three parallel lodes have been mined. Veins, lenses and pockets of high grade rock, several centimeters wide, dip 70° to 90° to the south |
| ● | Fine-flaky to lump-type graphite dominates |
| ● | Area is largely unexplored and prospective for a larger graphite ore body |
| ● | Nine major vein lodes on the site, all which have characteristics of being well-mineralized |
| ● | An average sample graded 49.2% high-grade graphite content |
| ● | 80% average recovery was achieved with limited liberation of the ore in flotation tests |
| ● | All three tailings have visible graphitic content of lump, crystalline medium to large flake graphite |
| ● | 84 samples of bulk-screened graphite recorded 41.58% graphite |
| ● | Unscreened samples recorded 35% graphite content |
| ● | Mining costs of the three bulk waste dumps in minimal, probably on the order of $30 a tonne. |
| ● | A wide distribution of graphite crystal sizes including approximately 15% of the +300 micrometer jumbo flakes. |
| ● | Test work indicates that a grade in excess of 97% can be achieved at recoveries in the range of 98-99% using a three stage flotation system with regrind. |
| 6 | Page |
Introduction
Background
This focus of this report is the processing of Next Graphite’s Aukam deposit in Namibia located in the Bethanien District, Karas Region, Namibia under Exclusive Prospecting License (EPL) 3895 that is currently held through a Nambian subsidiary by Next Graphite. This report includes a summary of the Aukam property based on prior work done by this author and others associated with Next Graphite (Next), Element 12 International (E12) and African Graphite – USA (AF-USA). The background and geology section is, by-in-large, directly copied from earlier work by Arno Brand of Element 12. The test work and processing sections are from earlier work by Dr. Ian Flint, also of Element 12.
Assumptions
A 0.6 to 1.25 tonne per hour mill feed tonnage producing a maximum of 0.25 – 0.5 tonne per hour is assumed. The material is assumed to consist only of the waste material from prior mining that is already on the surface. No analysis has been done to prove that this is an optimum rate economically. No mine life is reported in this analysis and mining is not reviewed. This data is then augmented, in this report, with the results of company processing activities to the end of 2014.
NI 43-101 non-compliant
This report does not conform to the standards specified in Canadian Securities Administrators’ National Instrument 43-101. The resources quantified in this report are highly conceptual and by no means compliant with NI 43-101. There is little information on the extent mineralization, physical properties, and continuity of the grade. These tonnages and grades must only be used internally and are not for distribution to clients or investors.
Location and Ownership
AGI, which has since become Next Graphite, entered into an option agreement on the Aukam Graphite property on the 15th of December 2013. The formerly abandoned mine site is located about 169 km SEE from Luderitz Bay, a small town with port and, rail facilities on the Atlantic coast. Access to the Aukam project is by driving 156 km East on the B4 Highway from Luderitz Bay towards Keetmanshoop, turning south onto the D446 district road heading southeast, after driving 49.6 km on this road turn right onto the D727, the deposit is located on an outcrop to the southwest of the road about 3 km from the turn off.
The “Aukam project”, exclusive prospecting license (EPL) 3895 makes up a total of 49,127 hectares (491.27 km2) and includes several historical small scale workings for tin, beryllium, fluorite, tantatlum, and graphite. The property is named after the Aukam Farm and easily searchable on Google Earth in the Karas District of Namibia.
Accessibility
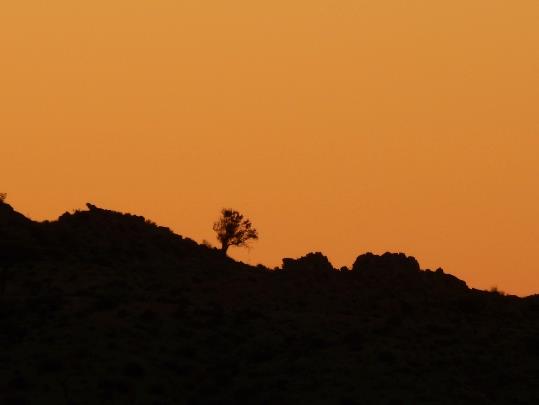
Access to the property farm gate is via a 52.6 km graded gravel road (D446 and D727) from the main tar road (B4 Highway). This road is accessible to conventional cars. From the farm gate to the foot of the range that hosts the deposit (another 1km) is only accessible by four-wheel drive gravel track that is relatively slow but essentially all-weather. The mine site workings are on a rugged slope and there is only limited access by a bulldozed road. Access to the upper adits and open pit (Figure 1) is only by foot.
| 7 | Page |
Climate
The Aukam Graphite deposit is located in an unusual area of southern Nambia with both summer and winter rainfall. In the austral summer, day-time temperature peak in the mid 40° Celsius, while in winter temperatures can go as low as freezing. Rainfall in winter is generally light drizzle with occasional harder falls and sometimes flurries. In summer, the rainfall is associated with occasional thunderstorms and is of short duration, but can be of very high intensity. All of the streams within the area are ephemeral and can flow very strongly after summer rainfall. Average annual rainfall is 50-150 mm.
The impact of this diverse climate is that an enclosed process building optional but recommended to prevent damage to equipment if the temperature falls below zero. It would also be a comfort factor for operational and maintenance staff.
Infrastructure
The infrastructure in the area is good with access to the site possible throughout the year. The Aukam Graphite deposit is relatively close to a main tar road and well graded so the only construction required would be a ±2 km long access road to site. There is a national power grid that passes right by the property. A link would likely be required should the project develop. Water is available in large amounts from underground Aquifers (there is an old pump station at the foot of the mountain which was used previously to supply operations with water. This does not seem to be in a working condition and would require a new borehole to be drilled for water access. The water pump can either be powered through a generator or a wind mill). The nearest rail link is located next to the main highway (some 70 km from site). Suitable areas for tailings dams and flotation plants are available dependent on eventual plant design. The nearest town; Aus, is some 87 km away by road.
A small list of auxiliary costs have to be incorporated into the costs of the site have listed in Table 1. These costs are ball park figures only as they are not based on Namibian costs, nor on drill depths, terrain conditions, or other unknown factors. Thus, they could be include significant errors.
Table 3: Estimated site auxiliary costs
| Item | Cost | |||
| Roads – 2 km, gravel assumed | $ | 40,000 | ||
| 100 KVA substation and site wiring | $ | 20,000 | ||
| Drill hole well and recycle water system | $ | 60,000 | ||
| Housing and employee facilities | $ | 100,000 | ||
| Ambulance and emergency facilities | $ | 60,000 | ||
| Graphite storage and load out facilities | $ | 80,000 | ||
| Communications system | $ | 10,000 | ||
| Tailings impoundment facilities | $ | 20,000 | ||
| Included auxiliary costs | $ | 390,000 | ||
| 8 | Page |
History
The Aukam graphite deposit was both open-pit and underground mined from 1940 and 1974 as shown in Figure 1. The historic production from this mine is shown in Table 1. The minable resource remaining is unknown. Schneider and Genis write that the best quality graphite came from the central lode. Underground workings are accessible at four levels where several thousand tonnes of graphite were recovered. In total about 25,000 tonnes of graphite was produced at this site from roughly 300,000 tonnes of rock when waste and development is considered.
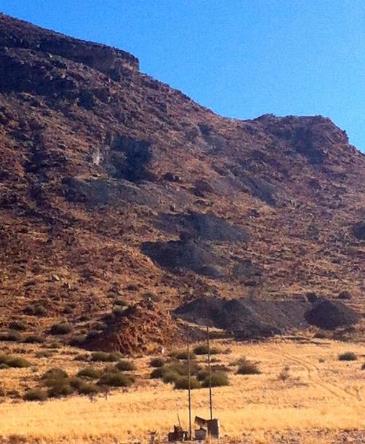
Figure 1: Open pit at the top of the mountain and several access tunnels and tailings ponds from operations lower down.
Table 4: Production at the Aukam Graphite mine (Source: Ministry of Mines and Energy Namibia)
| Year | Production | Year | Production | Year | Production | Year | Production | |||||||||||||||
| 1940 | 64 | 1955 | 917 | 1947 | 1640 | 1969 | 386 | |||||||||||||||
| 1941 | 172 | 1956 | 227 | 1948 | 1627 | 1970 | 336 | |||||||||||||||
| 1942 | 182 | 1964 | 251 | 1949 | 2265 | 1971 | 494 | |||||||||||||||
| 1943 | 1978 | 1965 | 359 | 1950 | 1380 | 1972 | 440 | |||||||||||||||
| 1944 | 1974 | 1966 | 363 | 1951 | 2627 | 1973 | 368 | |||||||||||||||
| 1945 | 1319 | 1967 | 436 | 1954 | 104 | 1974 | 137 | |||||||||||||||
| 1946 | 1193 | 1968 | 398 | |||||||||||||||||||
| 9 | Page |
Geological Setting
The Aukam graphite deposit is exposed in an erosional window incised through the hard layers of sedimentary rocks that mantle southern Namibia. The older hosting rocks, known as the Namaqualand Complex, are assemblage of gneisses, marbles, schists, quartzites, amphibolites with nested intrusive rocks including granite and gabbros. This suite of rocks indicates that the entire complex was once deeply buried. Intrustive events of charnockites has been dated between 1300 and 900 million years ago (Kroner and Blignault, 1976). Steep dipping shear zones are common and some are dated by Joubert (1974) around 1200 million years ago.
A prominent flat-lying and resistant sediment layer overlies the erosional unconformity at the top of the Namaqualand Complex. The specific formation has yet to be confirmed; however, it is likely to be the lowest most member of the Nama Group (Dabis Formation). The late Proterozic stratigraphic correlations in southwestern Africa (using data assembled from various authors by Germs [1995]). Section C in the Figure 2 is close to Aukam Farm and suggests the regional capping stone is the resistant Kaigas tillite. Tillites of Gariep Complex date from the unique period of global glaciations known as the Cryogenian.
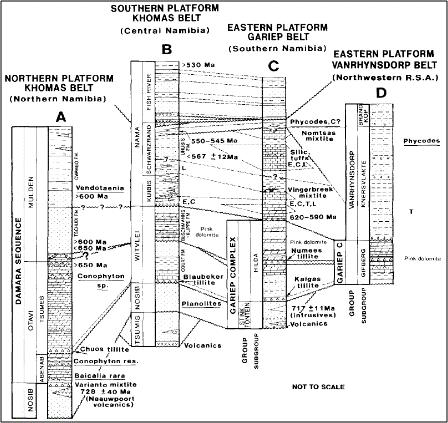
Figure 2: Stratigraphic section of the greater Aukam area(Germs [1995]).
| 10 | Page |
Other writers on the local geology place the Dabis Formation above the unconformity. If so the resistant capstone would be the Kanies member as illustrated in Figure 3.
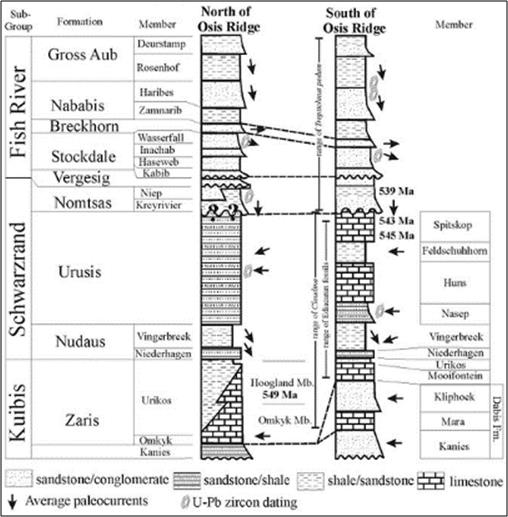
Figure 3: Stratigraphic section of the Dabis formation
Figure 4 is useful in that its shows that carbonates layers appear directly on the the Namaqualand Complex as one moves north (to the left) approaching the Oss Ridge. This change is observed in the cliffs on the north side of the Aukam window.
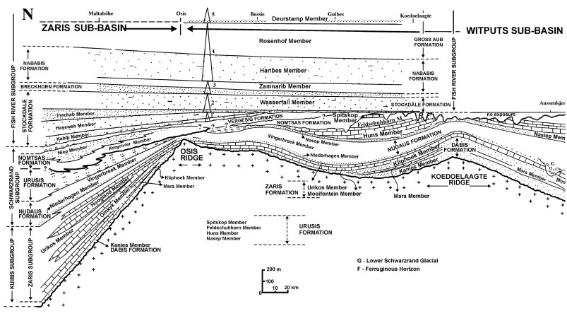
Figure 4: Stratigraphic section: Zaris basin
| 11 | Page |
Hydrothermal alteration is common to some rocks in the window as is pegmatite veining. Both are evidence of hot water flowing through the rock. The graphite occurs at one such site where over-pressured hot waters evidently carrying carbon dioxide and maybe methane mineralized carbon into a zone of broken rock. This hosting “shear zone” is exposed for 350 m and is about 10 m wide.
The sheared host rock at Aukam is Proterozoic granite that was hydrothermally altered to kaolinite (Reimer, 1984). The paper speculates on a biogenic origin however it also cites Mueller (1971) opinion that veins from an unspecified location in Namibia sounding like Aukam was an “inorganic derivation of the hydrocarbons”.
Schneider and Genis [2001] have published a brief description of the graphite deposit:
“The zone comprises three parallel lodes. Veins, lenses and pockets of ore, several centimeters wide, dip 70 to 90 degrees to the south. The graphite, which is of the fine-flakey to lumpy type, usually contains malachite specs, while sulphur occurs along cracks. The graphite veins are flanked by a pale-green, highly epidotized and kaolinized granite which is soft and highly decomposed.”
The grayish rock and lineaments in the Aukam shear zone are clearly visible in satellite imagery. An inspection of the satellite data has yet to find a similar structure, although there are multiple locations demonstrating alteration that need to be investigated for similar alteration haloes (Figure 5).
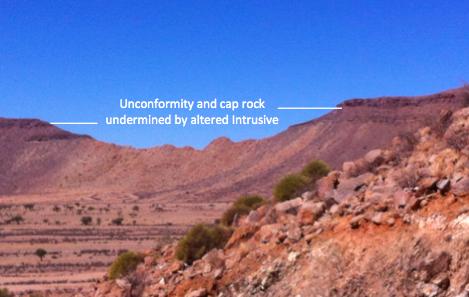
Figure 5: Unconformity, overlying Nama Group, altered intrusive and basement Namaqua Complex
| 12 | Page |
Mineralization
Introduction
Historical literature makes mention that the Graphite ore consists of lump and crystalline flake graphite containing carbonates including malachite and pyrite. Another author.[i] has mentioned that the Graphite hosted by the deposit is amorphous but there but visual and test result of the size class distribution indicate that it is vein and flake crystal types of graphite. Other mineralization is also present on site including tin and fluorite.
Trenching, sampling and measuring of tailings heaps
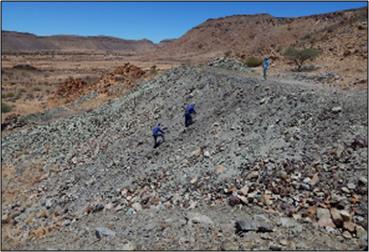
In prior mining a total of about 300 000 tonnes of rock was removed to recover 25 000 tonnes of graphite. The mining process appears to have been very selective in that only the graphite of sufficient quality to sell without processing was removed from site. The remainders of this mining are three major tailings heaps (Figure 12) that contain both lumpy and crystalline graphitic material. These heaps occur at the foot of the three drifts formerly used to access the high-grade graphite vein lodes. Each of these heaps were trenched at one meter intervals going up slope. Graphite fines seem to be prominent in all three heaps. Samples were collected at one-meter interval along the trench from the base of each heap. The lower heap is the major of the three and contains about ±100 000 tonnes of material (Figure 7). The mid and upper heaps are visibly smaller and contain about ±40 000 tonnes each. In total it is estimated that the three heaps combined contain about 180 000 tonnes of material graphite bearing rock (Table 2). Samples tests indicate an average of approximately 40-50% graphite. No assumptions are made in this report as to the representative nature of these samples.
 |
 |
| Figure 6: Trenching of lower stockpile heap. | Figure 7: The three major stockpiles after trenching |
Table 5: Summary of graphite waste heaps
| Waste heap | Size (tonnes) | Grade (estimated) | Contained Graphite | |||||||||
| 1 | 100 000 | 40 | % | 40 000 | ||||||||
| 2 | 40 000 | 40 | % | 16 000 | ||||||||
| 3 | 40 000 | 40 | % | 16 000 | ||||||||
| Total | 180 000 | 72 000 | ||||||||||
| 13 | Page |
Sampling and measuring of veins in the pit
Introduction
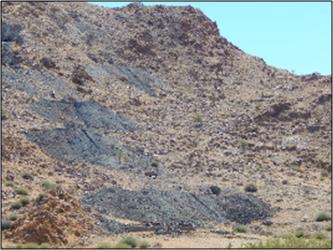
There are nine visible veins that outcrop on the side walls of the open pit at the top of the mountain. The veins measure between 20 cm several meters in width with a 70°-80° dip. Generally the veins strike in a northeasterly direction, 55 degrees (Figure 8). The pit was operated from 1940 – 1952 and yielded a total on the order of 17 386 tonnes of graphite material. Most of the graphite bearing ore within this pit has been mined. The outcropping veins are easily accessible for mining and could potentially yield as much as 1000t of graphite before having to start excavating the floor of the pit. This floor is filled with debris from a collapsed overhang above the southwestern wall (hanging wall) of the pit. If a drilling program indicates significant intersections of ore in the far reaches of the pit the overhang and hanging wall will have to be cut back in order to ensure a safe mining environment.
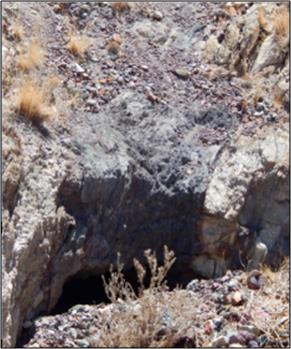
Incline at base of eastern wall of the open pit
An incline was cut diagonally into the base of the eastern wall of the pit accessing a meter wide high-grade graphitic vein dipping at a seventy degree angle to the south. The access to the incline has been netted to shelter it from debris falling in from the pit. The incline is overlain by debris from the pit and inaccessible (Figure 8 and Figure 9).
 |
 |
| Figure 8: Incline in the eastern wall of the main pit with prominent veins cropping out overhead. | Figure 9: Close up view of Incline overlain by debris from pit. |
It was not possible at the time of the site visit to investigate the geological merit of veins exposed within the Incline. The Outcropping vein above the incline was sampled across the face and sent to an accredited laboratory for analysis. If the analysis results indicate the presence of graphite, a drill program will be designed to drill the vein and a bulk sample will have to be taken, for the purpose verifying the extent and continuity of the mineralization. The outcropping vein is relatively easily accessible for mining purposes. In order to mine this vein lode the entire overhanging block hosting the graphitic material will have to be collapsed. The rock can then manually broken down into smaller manageable pieces that could be sized to fit through a processing plant for further liberation and concentration of the graphitic material. There are several other less prominent veins that could potentially be mined in a similar fashion, these veins have been sampled and analysis will reveal whether they are graphite bearing. (Figure 10)
| 14 | Page |
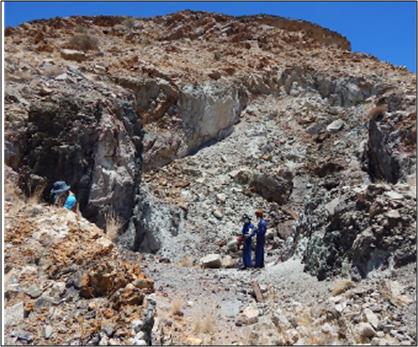
Upper Adit
The entrance to the adit is situated downslope from the open pit Access to the upper adit is restricted as debris from the tailings heap (directly above the access tunnel) has in filled the access point almost entirely making it impossible and unsafe to enter for purpose of geological observation (Figure 11). The access tunnel was cut into an out cropping shear zone which is believed to have mobilized fluids from deeper down carrying and precipitated out the graphite and several other associated minerals. The shear zone could potentially be graphite bearing but rather than the lumpy kind, which was originally mined from the main vein lodes, would be of the crystalline flake type which might require a higher degree of processing expertise to recover the graphite. The shear zone was sampled across the face where it crops out above the access tunnel.
 |
 |
| Figure 10: Open pit Aukam Graphite mine | Figure 11: Upper adit and shear zone |
Lower adit, shear zone and surface vein
The lower access adit cuts across three major vein lodes extending as far as 120 meters into the mountain. The entrance to the access adit lies at an elevation of 1267 meters above sea level cutting into a similar shear zone as, (but less prominent, measuring about two meters wide and dipping South), the one visible in the hanging wall of the entrance of the upper access adit. The two shear zones run parallel to one another both striking in a general northeasterly direction. The shear zone in the lower adit has a visibly lower graphitic content than the former; the veins are inter bedded with fine crystalline flake graphitic material. Investigating the extent of the shear is a lower priority exploration target at this point but could potentially be investigated at a later stage.
| 15 | Page |
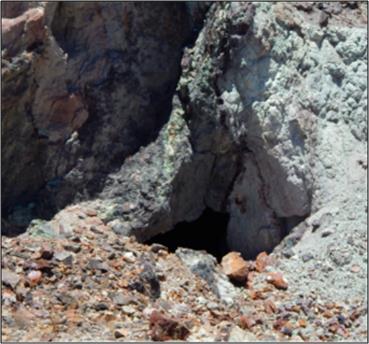
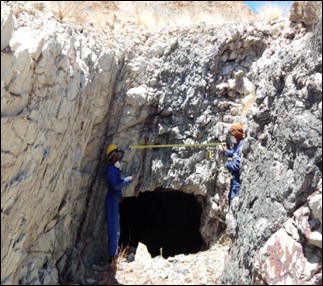
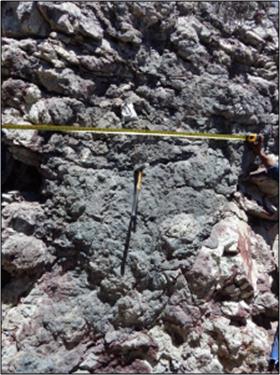
Weathered vein, lower access adit
A heavily weathered graphite vein is seen striking perpendicular to the shear zone on the western face of the clear cut leading into the entrance of the lower access adit. The vein measures about 1.6 m wide and appears to be well mineralized. A sample was collected across the weathered face (Figure 12 and Figure 13) and sent to an accredited facility where it will be analyzed during the next work phase to indicate the graphitic content contained within the sample. Further in phase two, the vein should be followed along strike, drilled and characterized more diligently to infer its graphitic content.
The first work face is roughly 70 meters into the lower access adit. The stoped area measures twelve meters long, four meters wide and an average of roughly two meters high (Figure 14). About 250 metric tonnes of rock was mined from the open stope (assuming a density of 2.7 g/cm3 ). There are several veins visible in the walls of the stoped area.
 |
 |
| Figure 12: Shear zone lower access adit | Figure 13: Exposed vein entrance lower access adit |
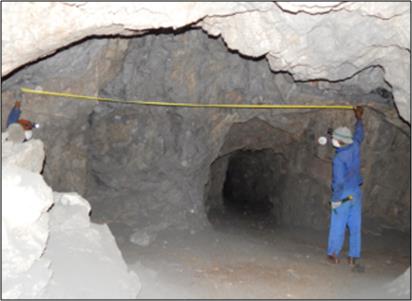
Figure 14: Vein load 1 work face, lower access adit
| 16 | Page |
The lower access adit was the final work phase of the former operations. If the mining operations ever recommenced it is most likely to assume operations would continue from this work level downward. Tested samples indicate that a feed grade of 40% could easily be averaged through a selective mining method. The vein loads vary in size and measures between 2-9 m across.
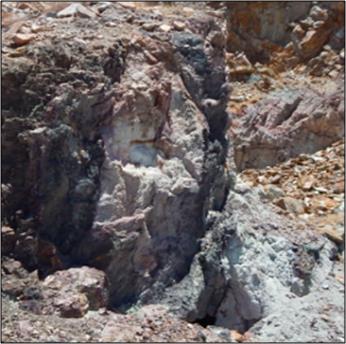
Abandoned workings and vein structure
The mine was formerly worked as an underground stoping operation. In the lower workings, an underground access adit and a perpendicular drift accessed five parallel graphitic vein loads. The first vein load occurs some 72 meters from the entrance of the access adit , a second 75 m drift was cut in a north westerly strike direction, in order to access vein loads 3, 4 and 5. Vein load 2 occurs immediately to the left of Vein load 1 in a southeasterly strike direction. That general layout of the previously mined vein along with the existing adits and drifts is shown in Figure 15.
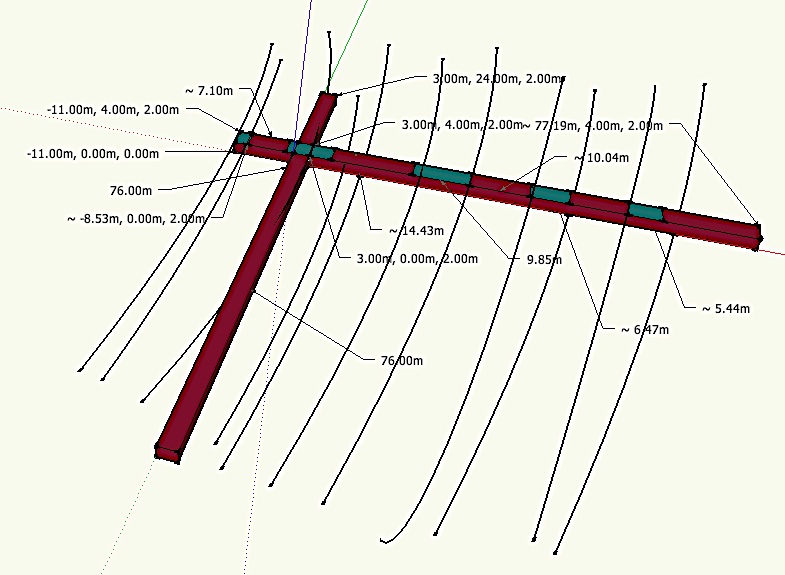
Figure 15: 3D model of lower access adit and drift. The grey blocks show the location of the major vein loads and the curved lines the general shear direction.
| 17 | Page |
Grades
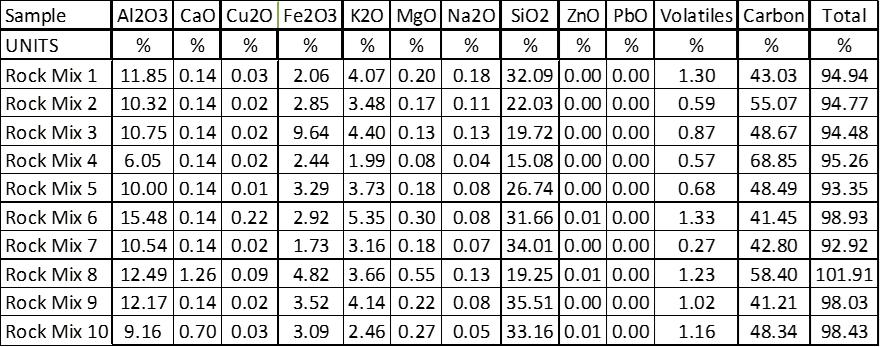
The results of samples taken of the exposed veins and possibly the waste dumps are shown in Table 3. No distinction are made as there where these samples originated within the sampling program. Generally, these samples ranged from 35-50% with a few reporting higher grades.
Table 6: Phase one exploration program: analysis results. Note: this work was not supervised by the author and depends on third party reporting.
| 18 | Page |
Processing – Test Work
Conclusions
| (1) | Equipment | |
| a. | The kinetics of flotation indicate that less than 120 seconds, in total, is needed as a residence time in the primary stage, and a similar time will be required in the secondary stage. | |
| b. | A grind size of 500 micrometers is sufficient for the primary size reduction circuit | |
| c. | Flotation will be carry capacity limited meaning that a short, wide, column will be required. | |
| d. | It is suggested that the primary circuit be composed of a rougher and scavenger so that reagent addition can be staged | |
| e. | The primary flotation concentrate should be reground to approximately 212 micrometers | |
| (2) | The majority of the graphite occurs in aggregates of graphite crystals that have a purity after flotation. Some of the larger flakes or aggregates have been bent at the 500 micrometer upper size and most of the graphite occurs as aggregates rather than individual flakes. As such, the particle size distribution can be adjusted by grinding to the size of the individual graphite flakes. The individual graphite flake particle size distribution has yet to be determined however it will be somewhat smaller than the 100 micrometer d50 size indicated in these tests. This is characteristic of vein graphite. | |
| (3) | Potential recovery is somewhat greater than 95% with greater than 99% being achieved at the primary float stage. Actual recovery will be a function of grade and may be operated at less than 99%. This recovery is based on material that has been tested and does not include any graphite lost due to selective mining, | |
| (4) | The lower limit of potential grade has been estimated at 97% based on a three stage flotation and 212 micrometer maximum size. | |
| (5) | Procedures for the secondary tests have been determined and these tests are currently ongoing. | |
| (6) | Significant retardation of flotation occurs due to minerals attached to the surface of the graphite. It is likely that a chemical leaching stage will be required to achieve grades of higher than about 85%. This leach may be before the float circuit or between the primary and secondary flotation stages. | |
| (7) | There is some evidence of native sulphur. The mineral will float with the graphite. Area that contain native sulphur should be avoided by selective mining. |
Note: All of these characterizations are likely of the poorer grade material left from prior mining. As such, they may not be representative of the material found in-situ within unmined veins. Flotation at sizes above 212 micrometers was poor probably as a result of precipitate particles coating the graphite. These particles may limit the ultimate grade of the graphite unless specific chemical treatment is used.
| 19 | Page |
Purpose
The purpose of these step I was three-fold:
| (1) | To determine the equipment required for the processing with the goal of producing graphite grading over 99% by way of determining the engineering data for both circuit design and scale-up of the primary and secondary stages | |
| (2) | To determine the morphology of the graphite | |
| (3) | To estimate potential graphite recovery | |
| (4) | To estimate a lower limit of the potential grade | |
| (5) | To determine the procedures to test phase II. |
Scope
Next Graphite is currently progressing on a test work program whose results will be used to finalize the design of separation systems to create graphite that has been optimized for the creation for high expansion factor and exfoliation applications. This is a three step process that includes size reduction and primary flotation for recovery, multiple cleaner stages of flotation for grade and, potentially, refining as shown in Figure 16. This report does not detail the refining circuit.
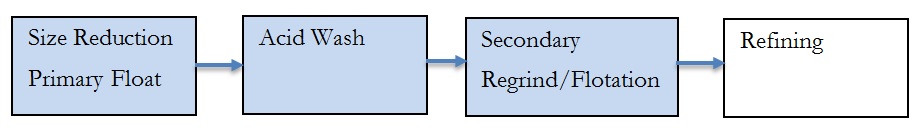
Figure 16: Three step test work for the creation of graphene pre-cursor graphite
The only material tested at this stage was only large lumps of weathered material from the waste dumps of Aukam old workings although geology indicates that the upper zones of the graphite vein(s) are similarly weathered.
Methodology
The sample material was reduced in size sequentially using a jaw crusher and a cone crusher at SGS – Lakefield. Microscope pictures were then taken of each size class. Relatively undamaged size classes where then floated in single rougher stage and the froth was collected over timed intervals. Reagents were added to maintain bubble size and the collection of graphite.
| 20 | Page |
Size Reduction
The purpose of the size reduction in these tests was not the production of liberated graphite but the production of graphite aggregates of suitable size for the next stage of size reduction while minimizing damage to the crystals. The following were concluded from this test work:
| (1) | As anticipated, visual observation of the crushed product confirmed at the graphite – graphite liberation has not occurred within these tests and that majority of the sample was of an appropriate size distribution of Step II testing. | |
| (2) | Due to the unliberated nature of these products the size class distributions presented represent that of the graphite particles but not of the graphite crystals. | |
| (3) | At a grind size of 1 mm poor flotation resulted. This size was chosen as, worldwide, other vein graphite does become liberated at this point. It is suspected that this phenomena is the result of fine particles of non-graphite on the weathered surfaces and the presence of non-liberated graphite on the surface of silica particles. | |
| (4) | At a grind size of 0.5 mm essentially 100% recovery was achieved at moderate grades of 70-76%. This probably indicates that the fresh surface of graphite generated in the grind where not covered with non-graphitic material. Inspection of the microphotographs of each size class indicates that small graphite particles are still found within silica particles at this grind. |
Laser assay particle size distributions performed by Gecko depict a variable particle size per unit volume with 80% passing 200µm and approximately 100µm ≥ 40% showing the most particle number size per unit volume. Two examples of this work are shown in Figure 17 and Figure 18.
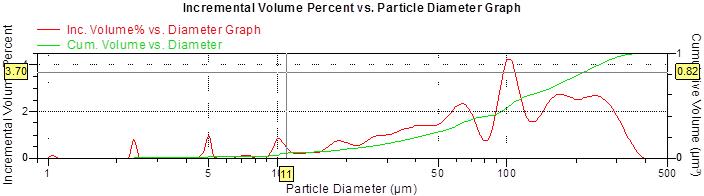
Figure 17: RM1 test for graphite particle size distribution: Note, this work was not supervised by the author and depends on third party reporting.
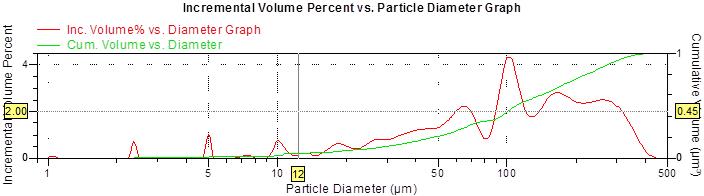
Figure 18: RM2 test for graphite particle size distribution. Note, this work was not supervised by the author and depends on third party reporting.
| 21 | Page |
The SGS-Lakefield generated particle size distribution that resulted is shown in Table 4 and and compared with the Gecko numbers in Figure 19
Table 7: Initial sample particle size distribution after cone crushing (SGS – Lakefield sieve analysis)
| Size (µm) | Cumulative Passing | |||
| 350 | 100 | % | ||
| 225 | 80 | % | ||
| 150 | 60 | % | ||
| 80 | 40 | % | ||
| 35 | 20 | % | ||
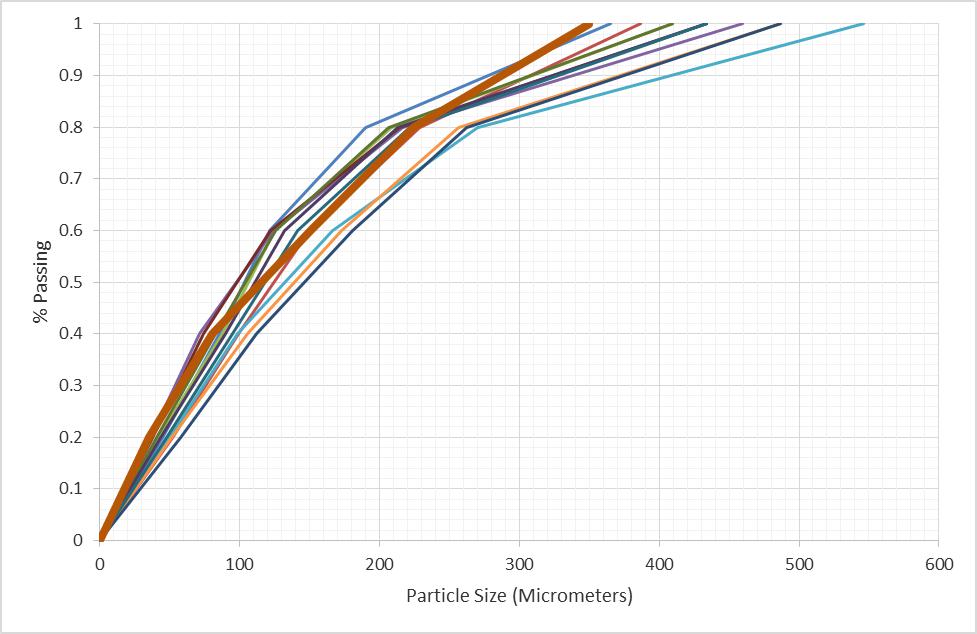
Figure 19: Test work grind particle size distribution. Thick line represents grind of SGS rougher tests (2014). Other lines represent prior particle size tests performed by Gecko (2014). Note, all sizes under 20% passing are estimated values.
| 22 | Page |
When determining particle size distribution of graphite two errors are usually present. These are the following:
| (1) | The graphite crystals are not liberated from each other. Graphite commonly grows in closely associated crystals. When graphite – graphite liberation is incomplete the indicated particle size is larger than individual graphite crystals. This is characteristic of under grinding of the graphite. | |
| (2) | The graphite crystals have been bend or folded. This is typical of over grinding of the graphite and presents as a size distribution shifted to smaller sizes. |
Visual inspection of these samples indicates that neither graphite / graphite nor graphite / non-graphite liberation was complete at any of the size classes inspected. However, it also shows that the larger graphite particles had already attained a rounded morphology. These two signs indicate that both (1) and (2) type errors were present.
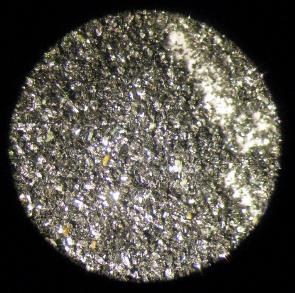
Figure 20 through Figure 23 are the photographs are the particles retained on the 50 (297 µm), 80 (177 µm) and 150 (100 µm) mesh screens that and material passing the 150 (< 100 µm ) mesh screen. On the #50 screen most of the graphite still occurs as chunks or aggregates of graphite. Some of the particles appear to be flakes. At this stage it cannot be proven if these are individual flakes or aggregate sheets. The number of flakes or flake like aggregates decreases with the decrease in the particle size; however, both shapes of aggregates occur at all four size fractions inspected.
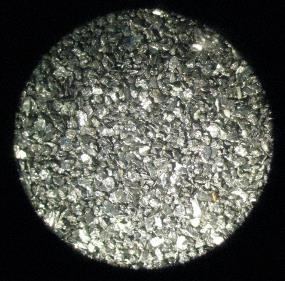 |
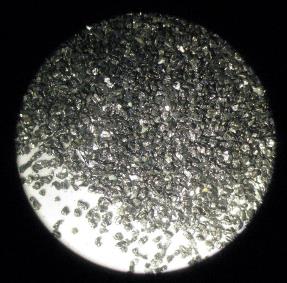 |
| Figure 20: +50 Mesh (all particles larger than 297 µm) graphite, post cone crushing (SGS-Lakefield) Note: this is a flotation laboratory microscope picture that is typically used to visually determine progress and is not of sufficient quality to determine sizes, liberation or estimate grades. This picture has been reduced to black and white from it colour original. | Figure 21: +80 Mesh graphite, post cone crushing (SGS-Lakefield) Note: this is a flotation laboratory microscope picture that is typically used to visually determine progress and is not of sufficient quality to determine sizes, liberation or estimate grades. This picture has been reduced to black and white from it colour original. |
| 23 | Page |
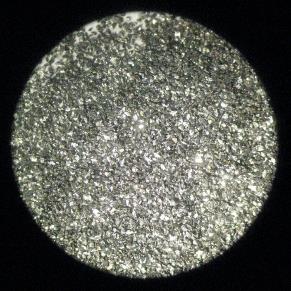 |
 |
| Figure 22: +150 Mesh graphite, post cone crushing (SGS-Lakefield); Note: this is a flotation laboratory microscope picture that is typically used to visually determine progress and is not of sufficient quality to determine sizes, liberation or estimate grades. | Figure 23: -150 Mesh graphite, post cone crushing (SGS-Lakefield); Note: this is a flotation laboratory microscope picture that is typically used to visually determine progress and is not of sufficient quality to determine sizes, liberation or estimate grades. |
| 24 | Page |
Flotation
| ● | The graphite grade of the 212 micrometer grind, initial cleaner tests indicated that 97% ± 2.6% is possible for the Aukam sourced graphite. These must be considered initial tests are cleaner tests with re-grind has yet to be performed. Note: these tests where conducted after an acid wash of the surfaces was conducted. | |
| ● | The high recovery at 99.3% over a 190 second residence time wherein 97.5% is recovered in 70 seconds, indicates very fast kinetics. As such, flotation will probably be carrying capacity limited and froth crowded could be used. | |
| ● | The flotation circuit could be composed of four stage separation in a closed circuit: primary grinding, primary flotation for recovery, followed by a regrind and a secondary flotation. As staged addition of collector was required the primary float will probably be composed of a rougher followed by a scavenger each with approximately a 50-70 second residence time. The secondary float will probably be composed of a cleaner and cleaner scavenger. |
Three series of flotation tests have been conducted. The first test, that used a top size of 1.0 mm as this size is suitable for some other vein graphite separations. However, this proved unsuccessful in terms of recovery. A second test was conducted at a top size of 0.5 mm which resulted in recoveries of over 99% of the graphite with a grade increase to between approximately 70-77% graphite in the primary flotation stage. Note, this test was done without acid leach. Thus, for the primary flotation, with respect to recovery, the size of the particles should be reduced to approximately 0.5 mm or somewhat larger. A time release test was performed to determine the flotation kinetics of each size class. This indicates that flotation is very rapid and that under 120 seconds is required for the rougher retention time. Sufficient data was achieved from these tests to design the primary circuit. Kinetics of the secondary float are typically similar so that this information can also be used to size the secondary circuit.
An additional series of tests was conducted using a 212 micrometer top grind size, and acid washed prior to flotation, in order to estimate the lower boundary of the final grade after three stages of flotation. This resulted in a grade of approximately 97%. These tests will be repeated using the 0.5 mm initial grind size followed by regrind to determine if grades of greater than 97% can probably be achieved after a secondary flotation as grades greater than 97% are considered a premium product and command significantly higher market values.
The head (feed) assay for this material was determined to be 53.4% graphite. This is higher than the 35-40% average of the waste dump wider sampling. Also, it must be cautioned that assays of this type are only accurate to within approximately 2.6% absolute; thus this assays should be read as 53.4% ± 2.6% carbon. Organic carbon content was not determined as the geothermal origin of the material usually precludes the natural presence of this type of carbon.
These tests indicate that a grade of 97% can be achieved at a 212 micrometer grind and almost 100% recovery. However, for grades higher than this a larger initial grind should be performed so that the graphite doesn’t encapsulate upon folding gangue particles. Initial tests indicate that this size should be on the order of a 500 micrometer top size. A regrind can then be used to reduce the particle size further to achieve a higher grades.
| 25 | Page |
The primary flotation tests were run in order to achieve recovery targets and to obtain flotation kinetics results so that the primary flotation circuit could be designed. These tests are run at as large a size as possible considering the liberation of the graphite. These tests were not run to achieve grades as this is the function of the secondary tests that are currently being conducted. The conditions of the first flotation tests (1 mm grind size) are summarized in Table 5 through Table 7.
Table 8: Condition, -#18 Aukam rougher flotation. (SGS-Lakefield 4L cell, 1,800 RPM.
| Stage | Fuel Oil | MIBC | Cond | Froth (s) | ||||
| Rougher 1 | 5 | 10 | 1 | 15 | ||||
| Rougher 2 | 0 | 10 | 1 | 15 | ||||
| 5 | 10 | 1 | 30 | |||||
| Rougher 3 | 5 | 10 | 1 | 60 | ||||
| Rougher 4 | 5 | 10 | 1 | 60 | ||||
| Rougher 5 | 5 | 10 | 1 | 120 | ||||
| Rougher 6 | 25 | 60 | 6 | 300 |
Table 9: Mass Balance, -#18 Aukam rougher flotation. Individual timed samples
| Weight | Assays, % | % Distr. | ||||||||||||||
| Product | G | % | C(t) | C(t) | ||||||||||||
| Rougher 1 | 99.7 | 10.1 | 79.1 | 14.0 | ||||||||||||
| Rougher 2 | 92.4 | 9.4 | 81.1 | 13.3 | ||||||||||||
| Rougher 3 | 158.6 | 16.1 | 76.2 | 21.4 | ||||||||||||
| Rougher 4 | 55.0 | 5.6 | 83.8 | 8.2 | ||||||||||||
| Rougher 5 | 38.3 | 3.9 | 79.9 | 5.4 | ||||||||||||
| Rougher 6 | 40.6 | 4.1 | 73.6 | 5.3 | ||||||||||||
| Rougher Tails | 501.8 | 50.9 | 36.5 | 32.5 | ||||||||||||
| Head ( calc. ) | 986.4 | 100.0 | 57.2 | 100.0 | ||||||||||||
| Head (direct) | 52.8 | |||||||||||||||
Table 10: Mass Balance, -#18 Aukam rougher flotation. Cumulative timed samples
| Weight | Assays, % | % Distr. | ||||||||||||||
| Combined Products | G | % | C(t) | C(t) | ||||||||||||
| Rougher 1 | 99.7 | 10.1 | 79.1 | 14.0 | ||||||||||||
| Rougher 1 +2 | 192.1 | 19.5 | 80.1 | 27.3 | ||||||||||||
| Rougher 1-3 | 350.7 | 35.6 | 78.3 | 48.7 | ||||||||||||
| Rougher 1-4 | 405.7 | 41.1 | 79.1 | 56.8 | ||||||||||||
| Rougher 1-5 | 444.0 | 45.0 | 79.1 | 62.3 | ||||||||||||
| Rougher 1-6 | 484.6 | 49.1 | 78.7 | 67.5 | ||||||||||||
This size was chosen as it approximates the size at which most of the gangue minerals and graphite become liberated. The poor recovery of the graphite was probably indicative of surface coating of the graphite by weathering products as very few new surfaces are created in the grinding process at this size. In these case the coating effect can be overcome by the creation of new surfaces (regrinding) or by an acid wash (in the case of carbonates). In order to improve the recovery the second set of tests were performed at a 500 micrometer upper size using the conditions outlined in Table 5. These results are shown in Table 8.
| 26 | Page |
Table 11: Conditions of < 0.5 mm grind release flotation test (test #2) using a 4L flotation cell at 1,800 rpm
| Regents (g/t) | Time (min) | |||||||||
| Stage | Fuel Oil | MIBC | Grind | Cond. | Froth (s) | |||||
| Rougher 1 | 20 | 10 | 1 | 15 | ||||||
| Rougher 2 | 10 | 10 | 1 | 15 | ||||||
| Rougher 3 | 10 | 10 | 1 | 20 | ||||||
| Rougher 4 | 10 | 10 | 1 | 20 | ||||||
| Rougher 5 | 10 | 10 | 1 | 60 | ||||||
| Rougher 6 | 10 | 10 | 1 | 60 | ||||||
| Total | 70 | 60 | 0 | 6 | 190 | |||||
The graphite recovery, with time that resulted from the time release test is shown in Table 9 for the #50 (297 µm), +#80 (177 µm), +#150 (100 µm) and passing or -#150 (smaller than 100 µm) at the time intervals of the test.
Table 12: Graphite recovery with time and particle size
| Recovery (%) | 15 (s) | 30 (s) | 50 (s) | 70 (s) | 130 (s) | 190 (s) | Tails | |||||||
| +50 mesh | 42.8% | 65.5% | 89.5% | 98.8% | 99.9% | 100.0% | 0.0% | |||||||
| +80 mesh | 43.8% | 70.2% | 91.8% | 99.1% | 99.8% | 100.0% | 0.0% | |||||||
| +150 mesh | 46.6% | 71.8% | 91.6% | 98.7% | 99.6% | 99.6% | 0.4% | |||||||
| -150 mesh | 31.3% | 55.9% | 81.4% | 95.0% | 98.5% | 99.5% | 0.5% |
These numbers are graphed in Figure 24. This rate of flotation indicates that almost 100% of the graphite floats within a two minute residence time.
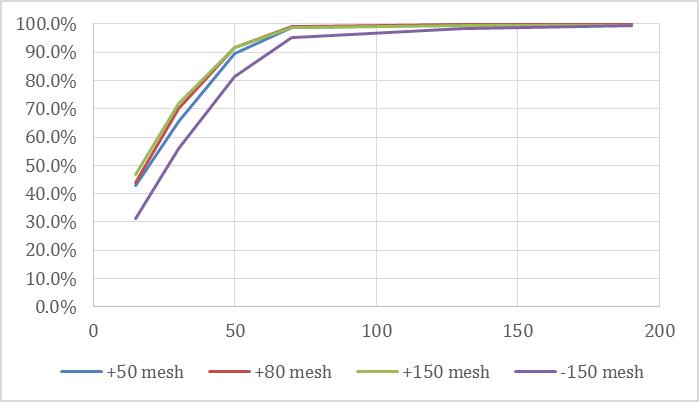
Figure 24: Recovery of graphite as a function of time for four particle size classes.
The associated grades are not critical in the rougher stage as these tests were conducted to determine if waste rock could be removed prior to acid wash in order to reduce costs.
For the sake of completeness, the grade with time response of this flotation was shown in Table 10.
| 27 | Page |
Table 13: Primary time – release test grade response. Note: these are the probably grades after the primary flotation stage and are not indicative of final circuit performance.
| Graphite Grades (%) | Feed | 15 | 30 | 50 | 70 | 130 | 190 | |||||||
| +50 mesh | 64.3% | 75.4% | 75.6% | 73.1% | 70.9% | 70.2% | 69.3% | |||||||
| +80 mesh | 57.7% | 75.1% | 74.8% | 72.0% | 70.2% | 69.2% | 68.3% | |||||||
| +150 mesh | 50.0% | 76.6% | 76.2% | 74.1% | 72.1% | 71.2% | 69.7% | |||||||
| -150 mesh | 52.7% | 75.9% | 76.5% | 75.5% | 74.4% | 73.5% | 72.2% |
The grade information will be used once the secondary flotation tests results are available to calculate the probable recycle between the different flotation stages.
| 28 | Page |
Processing Circuit
Summary
Other deposits of this nature have purified product to an excess of 99% graphite based on flotation followed by chemical refining. The physical separation circuit will probably be composed of crushing to approximately 0.5 cm in size followed by grinding to a size no smaller than the largest size of the graphite crystals. This size has yet to be determined but is likely to be on the order of 0.5 mm. This material will be floated at appropriate pH to reject iron and copper sulphides. The primary float product will then be acid washed to improve grades followed by a secondary float. A series of re-grinds and additional flotation may be required as the 97% grade was achieved using four stages of flotation.
The total estimated cost of the processing plant is approximately 600,000 USD for a plant that could process between 0.25 and 0.5 tonnes per hour. The processing facility could be operational is as little as 18 weeks without considering delays such as the delivery of external infrastructure and proper permitting and licenses.
These costs could be decreased to approximately $400,000 if water recycle from the tailings is not required, if the throughput is fixed at 0.25 tonne per hour, or it the flotation system is reduced from four stages to two and the building is reduced to a concrete pad.
The infrastructure, only on the site, would take about 4 weeks to prepare. The processing facility would take another 6 weeks for equipment shipping and 4 weeks for installation followed by another four weeks of operator training before it could be operational. Assuming no outside delays the shortest time for the processing plant to become operational is approximately 18 weeks.
These numbers do not include time for the appropriate permitting and external infrastructure such as delivery of water and electricity to the site which could be significantly larger than the costs of the processing plant.
The location of the processing plant should be determined on an economic basis considering the various infrastructure and transportation costs, housing, and access to replacement parts and maintenance.
Introduction
The initial NEXT Graphite circuit has been designed using the following criteria:
| ● | 2,000 – 4,000 tpa production (0.25 - 0.5 tph) running 24 hours a day. | |
| ● | No infrastructure is included outside the processing building. | |
| ● | That an enclosed building is not required. This may mean that extended periods of below freezing temperatures will require a mill shut down to prevent damage to pipes, pumps, valves and equipment. | |
| ● | Only graphite size reduction (one stage), flotation (4 stages) and acid wash are included. The circuit does not include regrinds or hot caustic leaching. The circuit, also, does not include a sulphur removal circuit. |
| 29 | Page |
The following assumptions are made in this design:
| ● | Maximum run-of-mine size of 10 cm | |
| ● | That graphite – waste liberation occurs at particle sizes somewhat larger than 0.5 mm | |
| ● | That much of the graphite is coated with malachite or other carbonate but not with silicates or alumino-silicates. | |
| ● | That the common usual graphite maximum particle is somewhat smaller than 0.5 mm | |
| ● | The majority of the carbonates are found only in small quantifies or are otherwise removed in the primary flotation. | |
| ● | That the contaminate silicates, alumino-silicates, metal oxides and metal sulphides are found on the surface and not within the graphite crystals |
The circuit has been divided into three sections:
| ● | Crushing and grinding – operated 4 hours a day | |
| ● | Flotation, dewatering and water recycle – operates 24 hours a day | |
| ● | Acid wash |
All sections are designed to be built in, or transported by, portable freight box cars to be shipped to site.
Test Work Implications
Flotation grades of greater than about 85% where not possible without an acid leach. This could be due to either carbonates coating the surface of the graphite or otherwise closely associated with the graphite. This means that an acid wash will be required after the rougher circuit. Carbonates at this point represent 0.3 to 1.3% of the ore (as oxides) or 2,100 (52.5 moles/tonne) to 9,600 g (240 moles/tonne) of Ca per tonne (with error due to oxidation mass changes). Assuming a pre-flotation leach, this will require between 2000 g and 8000 g of HCl per tonne in consumption plus an additional 7000 g to 14000 g that is potentially consumed by the iron sulphides present. As not all acid can be recovered and enough is required to suspend the particles it is also likely that 20-30% additional acid will be lost in the process. This will require a total consumption of acid on the order to 11 to 26 kg per tonne when applied to the waste dump feed with a carbon content of 35-40%. These consumptions are summarized in Table 11.
Table 14: HCl (100% equivalent) consumption approximations
| Stream | Neutarlization | Losses | Total | |||||||||
| Feed | 9 – 22 kg/tonne | 2.25-5.5 | 11.25-27.5 kg/tonne | |||||||||
| 1ST Cleaner Conc | 2.25 – 5.5 | 2.25 – 5.5 | 4.5 – 11kg/tonne |
As the pH must be increased to about 10 to reject any suphides in the 2nd cleaner that non-recycled acid must be neutralized with NaOH. A one-one weight ratio (not exact) is used to neutralize plus and additional amount to increase the pH. Thus, almost an equivalent amount of NaOH will be required.
| 30 | Page |
If this is applied after flotation consumption can be reduced to about 25% of the base values (2.25 – 5.5 kg/tonne) plus the non-recoverable material for
Note: the use of this type of acid wash may preclude using this graphite is some high end applications that restrict the chloride content of the graphite; such as premium nuclear graphite.
Overall Circuit
The generalized process circuit is shown in Figure 25. In this circuit the waste dump mined material if fed to a size reduction circuit that takes lumps are large as 10 cm and converts it to material all less than 0.5 mm in size. This material is then floated to form a graphite and waste stream. The graphite is then de-water and dried. The products from this circuit are waste (silicates, clays, calcite and others) and graphite.
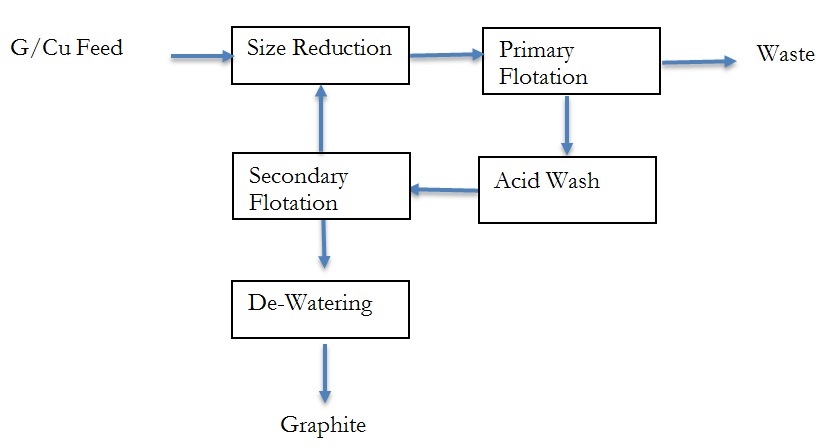
Figure 25: Overall process circuit blocks showing each major element of the processing system
| 31 | Page |
Size Reduction Circuit
The crushing and grinding circuit is designed assuming that the natural contours of the hill can be used to move the run-of-mine material from one stage of size reduction to another. The exception being wherever recycle is required. The circuit is configured as shown in Figure 26.
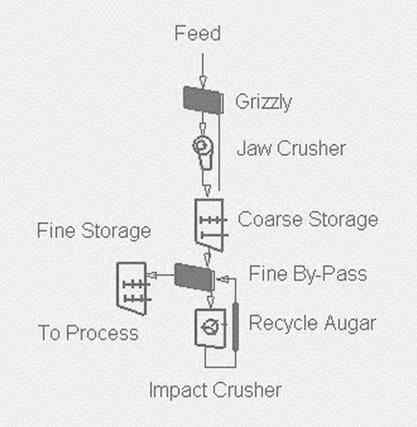
Figure 26: Initial crushing circuit
In this circuit, the run-of-mine material cross a grizzly, that is a screen designed to keep chunks of rock that are too large for the initial jaw crusher out of the process. The oversize material must be broken by hand and passed, again, through the jaw crusher. The grizzly itself is a plain metal rod mesh that is commonly available. If is often called a coarse “crusher screen” or crusher guard. The size of this guard is usually about a meter and a half on each side of a square and is often mount close to or immediately above the first crusher.
As an option, a second screen can be placed under the grizzly to direct any particles already smaller than 0.3 cm directly to the impact crusher.
The material passing the grizzly flow by gravity into the primary jaw crusher.
The size of the jaw crusher is based on the input size of the material and, usually, not the flow rate. Thus, the rock size of the mined material should be as small as possible. In this case, it is assumed that the largest chunk of rock from the waste dumps is no larger than 10 cm in both length and width (open side set). If possible, the jaw crusher should be sized to produce particles that are no larger than 0.3 cm (closed side set). If this is not the case more than one impact crusher may be required.
The coarse ore storage is used to buffer the capacities of the jaw crusher and the vertical impact crusher. This can be any storage facility. In this case, probably a smooth concrete pad. The graphite is still large enough not to be seriously impacted by the wind so it can be an outside mound or stockpile. Consideration should eventually be made of a cover the keeps both the wind and rain off. It can be gravity fed to a gate and into a chute that leads to the impact crusher(s). This pile should have at least a day capacity, or about 10 tonnes of material (4-5 m3 depending on particle size). The size of this area would depend on the contours it is built on.
| 32 | Page |
A chute leads from the coarse ore storage to the coarse screen. This is a vibratory screen thus should be secured in a similar way to the jaw crusher. This device allows particles smaller than the eventual product of the impact crusher to by-pass this device. Currently, this is assumed to be 0.4 mm.
The impact crusher is operated as a closed circuit wherein the product passes through the same 0.4 mm screen. Both the crusher feed and product pass this screen. Material held on the screen pass through the crusher over and over while the material passing the screen is goes to the next element of the circuit. It may be possible to remove some of the harder silicates from this screen. The same supports as the jaw crusher are required of this crusher.
The coarse product, that is larger than about 0.3 cm, is fed into a vertical impact crusher that reduces the size to approximately 0.4 mm. Like the jaw crusher, it must be anchored and placed on a secure base. This equipment is likely to cost on the order of $9,000 and is available from China on relatively short notice.
The fine ore storage must be covered as the graphite is now fine enough to be entrained in moderate winds. This can be a proper storage silo or an enclosed pile. Material is fed to the flotation circuit from this pile in the same manner as the coarse storage: usually on the side of the hill by a gate controlling flow into a chute.
A list of the major equipment in the crushinig circuit is summarized in Table 12.
Table 15: Crushing circuit equipment and approximate costs
| Equipment | Description | Cost | Source | |||||
| Grizzly | Metal rod screen and mounting on angle iron | $ | 500 | Local | ||||
| Chute | Angled smooth passage from grizzly to jaw crusher | $ | 500 | Local | ||||
| Jaw Crusher | 10 cm to 0.3 cm size reduction | $ | 8,000 | China | ||||
| Coarse Storage | Concrete holding area for graphite storage | $ | 5,000 | Local | ||||
| Chute | Angled smooth passage from stockpile to impact | $ | 1000 | Local | ||||
| Coarse screen | 0.4 mm vibrating screen | $ | 6,000 | China | ||||
| Impact crusher | Vertical impact crusher, 0.3 cm to 0.4 mm | $ | 9,000 | China | ||||
| Hydraulics | $ | 5,000 | ||||||
| Total | $ | 35,000 | ||||||
Note: augers or conveyors have not be included. Solids flow would be by manual labor or by gravity chutes.
| 33 | Page |
Flotation and dewatering
This circuit shows both primary and secondary flotation. The separations are performed in the flotation and dewatering circuits that is shown in Figure 27. In this circuit diagram the blue lines represent water and the black slurry or solids. The feed solids are added to the pulpers (upper right). The percent solids is maintained at approximately 20% solids throughout the circuit; initially by the pulping system then by strategically placed settling tanks. Three flotation columns are used in a rougher – rougher scavenger, and cleaner, with an optional cleaner – scavenger configurations. A jet mill is used as a regrind mill between the roughers and cleaners. Two belt vacuum filters are used and two driers.
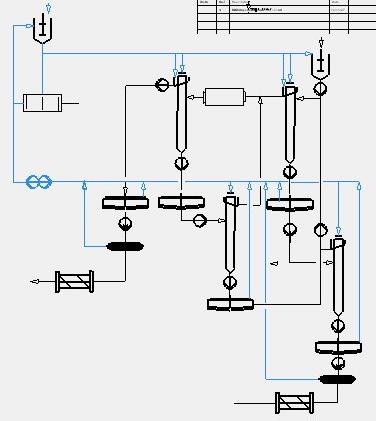
Figure 27: flotation, dewatering and water systems
Note the circuit does not show the sorting and bagging facilities. This is composed of a vibrating multilevel screen ($5,000) various chutes and storage bins ($15,000) and a bagging system for shipment.
| 34 | Page |
The estimated cost of each item is shown in Table 13. These prices will have to be quoted properly close to purchasing time.
Table 16: Approximate pricing of the Next processing flotation plant
| Tanks | 2000L + mixer | 2 | $ | 1,500 | $ | 3,000 | ||||||
| Float head tanks | 500L + mixer | 1 | $ | 1,300 | $ | 1,000 | ||||||
| Slurry Pump | 600-750 GPH | 10 | $ | 1,000 | $ | 10,000 | ||||||
| Flotation column | 0.30 m by 5 m | 3 | $ | 35,000 | $ | 105,000 | ||||||
| Settling tanks | 10,000L | 3 | $ | 1,000 | $ | 3,000 | ||||||
| Solids filters | 1tph | 2 | $ | 12,000 | $ | 24,000 | ||||||
| Positive D pumps | 200 GPH | 2 | $ | 2,500 | $ | 5,000 | ||||||
| Driers | 1 tph | 2 | $ | 5,000 | $ | 10,000 | ||||||
| Jet Mill (20% solids) | 750 GPH | 1 | $ | 20,000 | $ | 20,000 | ||||||
| Water storage | 10000L | 1 | $ | 1,000 | $ | 1,000 | ||||||
| Water filter | 2,000 L | 1 | $ | 5,000 | $ | 5,000 | ||||||
| Hydraulics | $ | 13,000 | ||||||||||
| Total | $ | 200,000 |
Acid Leach Circuit
The acid leach circuit is composed of an acid storage and preparation area and equipment, a leaching tank that gives about a twenty minute residence time, a dewatering settler, a neutralization and repulping vessel and assorted pumps. These costs are summarized in Table 14
Table 17: Approximate costs of major equipment of the acid wash circuit
| Tanks | 2000L + mixer | 2 | $ | 3,000 | $ | 6,000 | ||||||
| Acid storage | 100L | 1 | $ | 1,000 | $ | 1,000 | ||||||
| Metering pump | < 1 GPH | 1 | $ | 1,000 | $ | 1,000 | ||||||
| pH meter | 2 | $ | 1,000 | $ | 2,000 | |||||||
| Controller | 2 | $ | 500 | $ | 1,000 | |||||||
| Slurry Pump | 600-750 GPH | 2 | $ | 1,000 | $ | 2,000 | ||||||
| Settling tanks | 10,000L | 1 | $ | 2,000 | $ | 2,000 | ||||||
| Repulper | 500L plus mixer | 1 | $ | 2,000 | $ | 2,000 | ||||||
| Hydraulics | $ | 3,000 | $ | 3,000 | ||||||||
| Total | $ | 20,000 |
| 35 | Page |
The summary of all individual subcircuit costs are summarized in Table 15 as approximately $600,000. This estimate contains a 20% contingency factor as the design is based on limited test work meaning that circuit change may be required soon after production.
Table 18: Total estimated process plant costs
| Building | 12 m x 16 m | $ | 60,000 | |||||||||||
| Crushing/grinding | $ | 35,000 | ||||||||||||
| Flotation/Dewatering | $ | 200,000 | ||||||||||||
| Acid Leach | $ | 20,000 | ||||||||||||
| Sorting and shipping | $ | 20,000 | ||||||||||||
| Hydraulics power | $ | 45,000 | ||||||||||||
| Subtotal | $ | 380,000 | ||||||||||||
| Infrastructure | $ | 20,000 | ||||||||||||
| Shipping | $ | 80,000 | ||||||||||||
| Contingency | $ | 120,000 | ||||||||||||
| Total | $ | 600,000 |
Operating Costs
The operating costs, based on electrical consumption ($0.06/kWhr) and reagents is estimated to fall between $20 and $30 per feed tonne with variations in grade and depending on the acid consumptions ($60 per tonne of graphite)
This does not include personnel costs. Single shift personnel required will be one plant manager ($40,000), one metallurgist ($30,000) and one clerical staff ($15,000). Multiple shift personnel will be four operators ($20,000), two laborers ($15,000), one electrician ($25,000) and one mill wright ($25,000) per shift for a total of $85,000 + $160,000 per shift. Assuming four shifts (2 weeks on and 2 weeks off) the personnel costs will be about $725,000 per year or $60,400 per month. Once operation is achieved with is a cost of $145 per tonne (based on 0.25 tonnes per hour of graphite)
It is anticipated that equipment repair will result in approximately 10% of the capital cost per year, or about $60,000; for a per tonne cost of $12 per tonne.
The total processing plant operating costs are estimated to be between $217 and $237 per tonne of graphite.
Working Capital
A total of $600,000 will be required for the equipment, and additional 20% will be required for installation, and probably another 20% of spare parts as replacing equipment in the southern desert of Namibia would require considerable time if parts are to be ordered upon failure. Thus, about $840,000 should be set aside for this purpose. The commissioning time used to get the plant working as it should is likely be on the order of two months. There after it may be 2-4 months before sales can be achieved. Thus, two months of employee costs ($120,800) plus four months of operations ($200,000) should be on hand. Thus the total capital needed prior to cash flow is likely to be on the order of $1,160,000. Note: this assumes that marketing goes well and sales can be made.
| 36 | Page |
Marketing
Processed Product
Graphite sales are dependent upon the relationship between producer and seller.
Graphite Production is analyzed based on the number of tonnes of graphite bearing rock processed. In this example a head grade of 40% is used along with a recovery of 90%. These numbers are reasonable as there is always some dilution of the mine product with wall rock. Recovery could be as high as 95% however 90% is used to err on the side of caution. The processed product grade has assumed to be 97% - 99% although a large fraction of +99% is certainly possible.
Table 19: Current particle size distribution with assumed recoveries (90%) grade of mined material (40%) used to predict the total amount of graphite produced under 2 500, 5 000 and 10 000 tpa scenarios.
| Size (µm) | % | 2500 tpa | 5000 tpa | 10000 tpa | ||||
| 300 | 0.15 | 135 | 270 | 540 | ||||
| 177 | 0.2 | 180 | 360 | 720 | ||||
| 100 | 0.25 | 225 | 450 | 900 | ||||
| 35 | 0.2 | 180 | 360 | 720 | ||||
| -35 | 0.2 | 180 | 360 | 720 | ||||
| Total | 900 | 1800 | 3600 |
Four scenarios are presented for each of the 94-97%, 97-99%, 99-99.9% and greater than 99.9% graphite product grades (Table 14 to Table 17). These four are the following:
| ● | High is the upper price anticipated for long term high reliability suppliers | |
| ● | Low is the lowest price anticipated for long term high reliability suppliers | |
| ● | The Discounted price assumes 80% of the high price when dealing with a carbon trader on a long term basis | |
| ● | The low discounted price assumes 60% on the low prices assuming a worst case scenario. |
| 37 | Page |
Table 20: Case I: 94-97% product grade.
| General Price | Discounted Price | |||||||||||||||
| Size (µm) | High | Low | High (High) | Low (Low) | ||||||||||||
| 300 | $ | 1,500 | $ | 1,000 | $ | 1,200 | $ | 600 | ||||||||
| 177 | $ | 1,200 | $ | 900 | $ | 960 | $ | 720 | ||||||||
| 100 | $ | 900 | $ | 600 | $ | 720 | $ | 360 | ||||||||
| 35 | $ | 700 | $ | 560 | ||||||||||||
| -35 | ||||||||||||||||
| Average | $ | 785 | $ | 480 | $ | 628 | $ | 456 | ||||||||
| Total (2.5 ktpa) | $ | 0.707 | $ | 0.432 | $ | 0.556 | 3600 | |||||||||
Table 21: Case II: 97-99% Product grades
| General Price | Discounted Price | |||||||||||||||
| Size (µm) | High | Low | High (High) | Low (Low) | ||||||||||||
| 300 | $ | 2,000 | $ | 1,500 | $ | 1,600 | $ | 900 | ||||||||
| 177 | $ | 1,600 | $ | 1,000 | $ | 1,280 | $ | 600 | ||||||||
| 100 | $ | 1,200 | $ | 800 | $ | 960 | $ | 480 | ||||||||
| 35 | $ | 800 | $ | 600 | $ | 640 | $ | 360 | ||||||||
| -35 | ||||||||||||||||
| Average | $ | 1,080 | $ | 745 | $ | 864 | $ | 447 | ||||||||
| Total (2.5 ktpa) | $ | 0.972 | $ | 0.671 | $ | 0.778 | $ | 0.402 | ||||||||
Table 22: Case III: 99-99.9% Production grades
| General Price | Discounted Price | |||||||||||||||
| Size (µm) | High | Low | High (High) | Low (Low) | ||||||||||||
| 300 | $ | 3,000 | $ | 1,800 | $ | 2,400 | $ | 1,080 | ||||||||
| 177 | $ | 2,400 | $ | 1,600 | $ | 1,920 | $ | 960 | ||||||||
| 100 | $ | 1,800 | $ | 1,200 | $ | 1,440 | $ | 720 | ||||||||
| 35 | $ | 1,200 | $ | 800 | $ | 960 | $ | 640 | ||||||||
| -35 | $ | 1,000 | $ | 400 | $ | 800 | $ | 240 | ||||||||
| Average | $ | 1,820 | $ | 1,130 | $ | 1,456 | $ | 704 | ||||||||
| Total (2.5 ktpa) | $ | 1,638 | $ | 1.017 | $ | 1.310 | $ | 0.634 | ||||||||
| 38 | Page |
Table 23: Case IV: +99.9% Product grades
| General Price | Discounted Price | |||||||||||||||
| Size (µm) | High | Low | High (High) | Low (Low) | ||||||||||||
| 300 | $ | 8,000 | $ | 3,000 | $ | 6,400 | $ | 1,800 | ||||||||
| 177 | $ | 4,000 | $ | 2,000 | $ | 3,200 | $ | 1,600 | ||||||||
| 100 | $ | 2,000 | $ | 1,500 | $ | 1,600 | $ | 900 | ||||||||
| 35 | $ | 8,000 | $ | 1,000 | $ | 6,400 | $ | 600 | ||||||||
| -35 | $ | 8,000 | $ | 3,000 | $ | 6,400 | $ | 1,800 | ||||||||
| Average | $ | 5,700 | $ | 2,025 | $ | 4,560 | $ | 1,215 | ||||||||
| Total (2.5 ktpa) | $ | 5,130 | $ | 1.823 | $ | 4.104 | $ | 1.094 | ||||||||
The price obtained, be it high or low, or discounted depends on the experience and efforts of the marketing team, long term cooperation with clients, an established claim of reliability, and the graphite characteristics including grade, crystal morphology and the levels of application specific requirements.
It is possible that additional grades can be achieved using chemical refinery methods. However, this has yet to be tested. It is unlikely that the graphite can be used for graphene or
Cash Flow
Test work suggests that the 97-99% grade is achievable. It is unlikely that a higher grade will be achieved without a refinery stage. Thus, not considering the first couple of months were mistakes will be made, a per tonne revenue of about $650 should be achieved in year one, $850 in year two and finally moving to $1,080 per tonne in years three onward.
Operating costs are assumed to be $237 per tonne for processing, mining ($20 per tonne assumed) and marketing (20% of revenues). Corporate overhead costs which are beyond the scope of this study
These numbers are approximate based on a low feed grade that limits production to 2,500 tonnes per year. Higher grade feed can double this through put to about 5,000. As such, this should be considered a low estimate.
Risks
Technical
| ● | Test work performed on the material has not been aimed at the removal of certain contaminate minerals. Thus, the presence of mica and sulphur in particular have not been assessed. Both an have considerable impact on the process plant performance | |
| ● | This is a complex ore that could require considerable flexibility in the processing that has not been tested |
| 39 | Page |
| ● | The highly variable carbonate content may indicate that zones within the stockpile may be not economic | |
| ● | Water resources could be scarce resulting in processing with elevated hardness or fine suspended particles which may reduce the overall maximum grade of the product. | |
| ● | The process plant, as currently suggested, would be located a long drive from centers where replacement parts could be obtained. This risks plant shut down over lack of small parts. | |
| ● | There is no method of on-stream analysis to determine graphite grade, in real time, during production. |
Personnel
| ● | While mining and processing personnel may be available there is not a history of graphite mining in the area. This means that experienced personnel may not be possible to find. This could result in substandard performance over a considerable length of time | |
| ● | The isolated location may make the retention of skilled workers problematic. It might be worthwhile considering an in/out system where in employees work 12 hour shifts for two weeks then have two weeks off. |
Timelines
Timelines are based on best estimates internationally and may not be indicative of the pace at which things can get done in Namibia.
Marketing
The marketing of graphite takes considerable time, effort and talent. This might not be available to the company or may be prohibitively expensive when compared to the small production rates. In addition, most clients will require certain tonnages that might not be met by small production making marketing that much more difficult
40 | Page